PropNex Picks
|October 22,2025Resale Condo Market Watch in September 2025
Share this article:
Resilient resale condo activity in September amid Hungry Ghost Festival
Sales momentum in the overall property market resurged in September, including the resale condo market. About 997 condo units worth $1.98 billion was resold during the month - compared with the 1,087 resale transactions valued at $2.13 billion transacted in August.
The resale home market demand remained robust during the month as new launches slowed down. Momentum in the new sale market took a slight pause towards the second half of August and first half of September due to the seasonal lull during the Hungry Ghost Month. In September, new sales accounted for less than 20% of non-landed transactions, while resale deals accounted for the majority of transactions (77%, see Chart 1).
Chart 1: Proportion of private non-landed transactions (excl. EC) by sale type by month
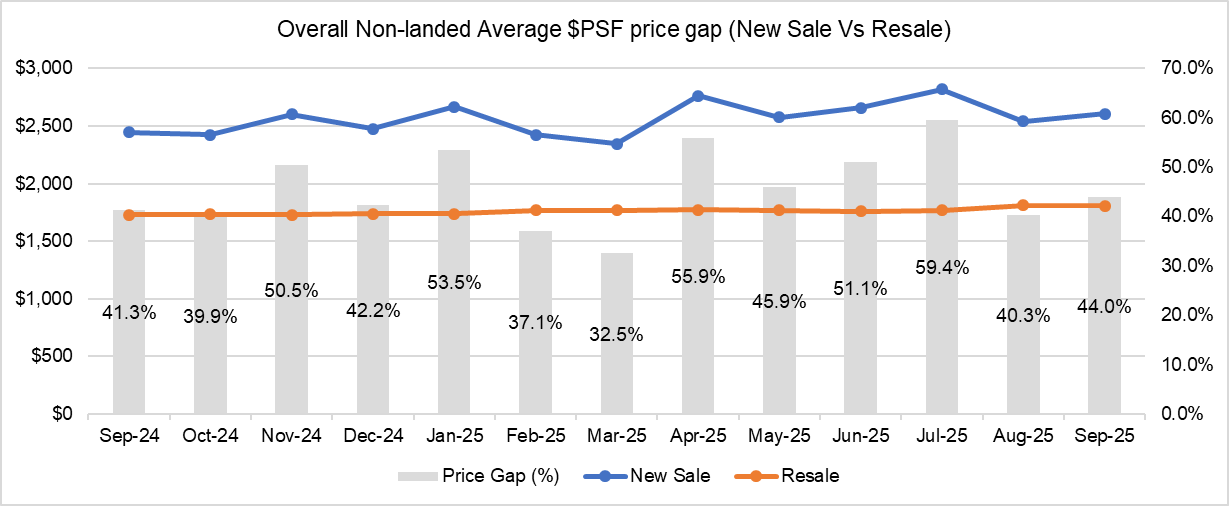
Despite the drop in new launch activity during the month, the average unit price of new non-landed homes expanded slightly. The average new sales price grew by 2.5% month-on-month (MOM) to $2,605 psf in September, while the average resale unit price slipped marginally by 0.1% MOM. As such, the new sale and resale price gap recovered slightly after hitting a 5-month low of 40% in August (see Chart 2), to 44% in September.
Chart 2: New sale and Resale Price gap of non-landed homes (overall) by month
Stable gains amongst resale transactions
In terms of profitability, resale condo units transacted in September saw similar gains compared with the previous month. Analysing the profits reaped by resale non-landed private homes in August and September 2025, it was found that resale condo deals garnered slightly smaller profits. The proportion of loss-making transactions dipped slightly in September 2025 over the previous month. The resale profit analysis involves computing gains achieved for the units by matching the condo resale transactions in August against their respective previous purchase price, according to caveats lodged.
The study showed that 14.9% of resale condo transactions (138 deals) in September made more than $1 million in profits, a slightly higher proportion to August (13.6%). Of these million-dollar profit-making deals, the deals are evenly distributed amongst the three market segments, 36% in the Core Central Region (CCR) homes and 33% in the Outside Central Region (OCR), followed by the city fringe or Rest of Central Region (RCR) (32%) homes. Loss-making deals in September accounted for 4.7% of transactions, down slightly from 4.8% in August (see Chart 3).
Chart 3: Proportion of profit quantum of resale non-landed transactions (August 2025 vs September 2025)
The average profit was subsequently computed on a project basis. To minimise sampling errors, resale condominium projects that posted fewer than three transactions during the month are excluded from the study. Based on URA Realis caveat data analysed by PropNex Research, the most profitable condo in the CCR, was Sommerville Park in District 10, which pulled in an average profit of $1.75 million across three transactions in September.
In the RCR, the most profitable condo development in September was The Sea View, a project located in District 15, which achieved an average profit of $1.84 million, across four transactions. In the heartlands or Outside Central Region (OCR), the most profitable project was Southhaven II in District 21 which garnered an average profit of $2.04 million across three transactions. Southhaven II was also the overall best performing project in terms of average profit quantum in September.
Top Resale Condo projects^ in terms of average gross profit* by region (September 2025)
Project Name | No. of transactions | Average Profit Gained ($) | Average Annualized Profit (%)# | Year completed | District |
CCR | |||||
| SOMMERVILLE PARK | 3 | $1,752,667 | 9.6% | 1988 | 10 |
| MIRAGE TOWER | 3 | $1,228,333 | 3.4% | 1996 | 9 |
| D'LEEDON | 5 | $780,052 | 2.1% | 2014 | 10 |
RCR | |||||
| THE SEA VIEW | 4 | $1,837,968 | 5.5% | 2008 | 15 |
| CARIBBEAN AT KEPPEL BAY | 3 | $1,089,000 | 3.3% | 2004 | 4 |
| TREVISTA | 3 | $1,075,167 | 6.0% | 2011 | 12 |
OCR | |||||
| SOUTHAVEN II | 4 | $2,039,500 | 5.1% | 1999 | 21 |
| COSTA DEL SOL | 3 | $1,423,173 | 4.4% | 2003 | 16 |
| PARC PALAIS | 3 | $1,319,933 | 3.8% | 1999 | 21 |
*Gains are derived from the resale transaction for each unit against the unit's last caveated transaction; the average profit is determined on the profits of all resale transactions in the development which occurred during the month. The profit reflected is gross - it has not accounted for the applicable seller's stamp duties, interest payable, taxes and other relevant divestment costs.
#Annualised Gains is the compounded annual rate of return which shows the rate of return over the time period between the point of resale and the property's last caveated transaction, expressed in annual percentage terms. The formula for determining this is simply: [(current resale price) / (purchase price)] time period in years-1Analysis was done based on available data from URA Realis
Going by districts, resale homes in District 11 (Watten House, Novena) raked in the highest profits on quantum basis, with transactions reaping average gains of over $1.4 million per deal. In terms of annualised gains, resale homes in District 20 (Bishan, Ang Mo Kio) enjoyed an average annualised profit of 4.9% per deal.
Top 10 Resale Condo districts^ in terms of average gross profit* (September 2025)
District | No. of transactions** | Average Gains ($) | Average Annualised Gains (%)# |
D11 | 23 | $1,413,481 | 3.4% |
D21 | 41 | $934,381 | 4.3% |
D10 | 69 | $884,105 | 2.9% |
D16 | 32 | $689,657 | 3.8% |
D15 | 67 | $668,512 | 3.8% |
D9 |
Explore Your Options, Contact Us to Find Out More!
Selling your home can be a stressful and challenging process, which is why
it's essential to have a team of professionals on your side to help guide you through the journey. Our
team is dedicated to helping you achieve the best possible outcome when selling your home.
Find Your Ideal Property: Take the First Step and Indicate Your Interest!More Property PicksDiscover New Launch Projects


Appointed Marketing Agency:PropNex Realty Pte Ltd - Licence No: L3008022J Shawn Koh | R024546E Privacy PolicyQuick Links
|